The question
Leadership's question was broad: why isn't this business making money? Answering it meant first getting to numbers everyone could agree on. The data lived in four separate systems, and those systems didn't agree with each other.
One version of the truth
I integrated data from all four source systems, using SQL to join and validate them, and built automated reconciliation routines so mismatches were caught automatically. That kept reporting accurate across 120+ daily KPIs.
Just as important was agreeing on what each number meant. I sat down with operations and finance to pin down metric definitions, so that "margin" or "volume" meant the same thing in every report.
Finding the gap
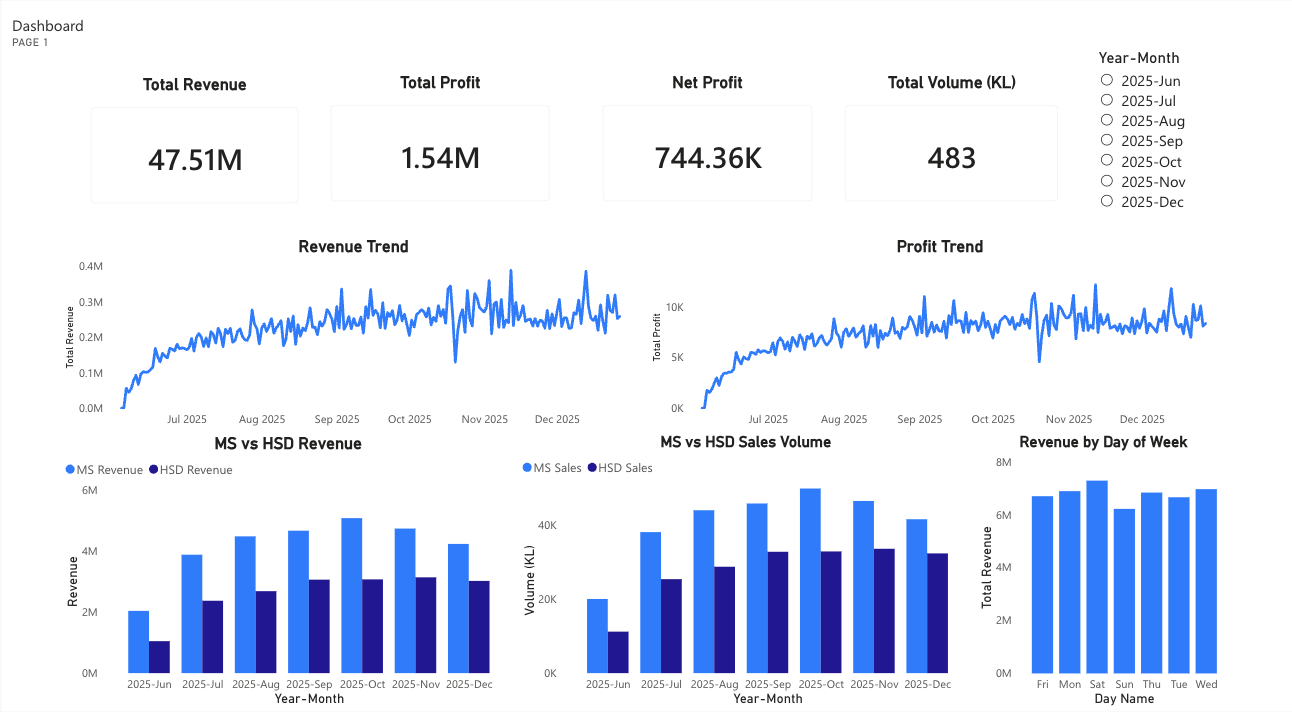
With clean, reconciled data, I traced the losses to a margin gap that no one had caught. I then built Power BI reporting (DAX measures and back-end data models) that made the gap, and progress on closing it, visible to leadership.
Forecasting inventory
Fuel is expensive to hold and costly to run out of. I used demand forecasting and statistical analysis in Excel (Power Query, VBA) to guide inventory and pricing decisions, holding a 4-day inventory cycle with zero stockouts across about $96K in monthly procurement.
Mapping the local market
To understand competition, I built a Power BI dashboard on a semantic model that mapped 9 competitor fuel stations by their coordinates, each labeled with its metrics. It tracked monthly petrol and diesel sales separately, showed our share of the local market, and had a separate performance card for our own station.
The result
Fixing the margin gap moved the business from a monthly loss to a 23.3% annual ROI in four months.
Throughout, my job was translation: partnering with operations, finance and supply to gather requirements, and turning findings into recommendations that non-technical leaders could act on.